
 What happened
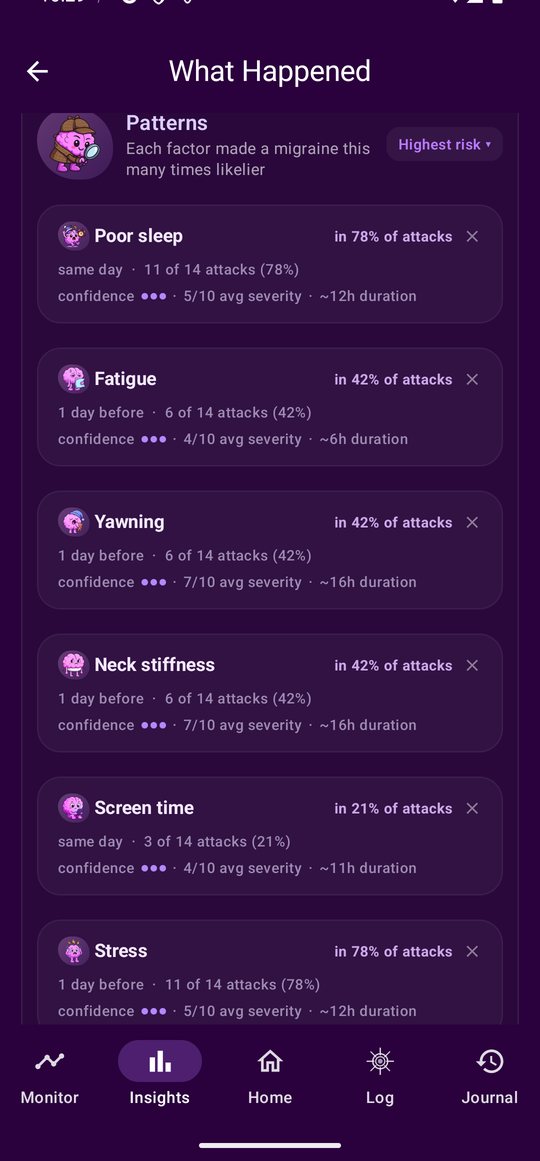
Which triggers actually precede your attacks, ranked by how much more likely a migraine is when they show up, and in what share of attacks. A line reads like tyramine, 25.9 times, in 21% of attacks. The engine uses a proper significance test, so a trigger that appeared once by chance does not top the list.
 Dangerous combinations and what worked
Some things only bite together. The engine finds the pairs that raise your risk more than either does alone. On the other side, every medicine and relief is scored on the relief you reported and how often you used it, so you can see what is earning its place.
 Monitor: one graph per thing
Monitor is where the graphs live: one card per thing you track, Migraines, Environment, Sleep, Diet, Cognitive, Physical, Menstruation and Risk, each opening its history with your attacks laid over it. The weather graph adds the forecast zone ahead of today.
Where it lives in the app
Insights → What Happened ranks each factor: how much more likely an attack is when it shows up, in what share of your attacks, with a confidence marker, the average severity that followed and how long those attacks ran. Combinations and What Worked sit beside it, and Monitor holds one history graph per thing you track.
What it needs from you
About five logged attacks before the engine has anything to say, and more days to sharpen it. What it reports is correlation, stated as correlation: how much more likely, in what share of attacks, leaving the judgement to you and your doctor.